Performance monitoring of TIBCO BW based applications is an important task in any organization to ensure that memory, CPU and other resources are used efficiently and to identify or detect any abnormal behaviours in the developed solutions to take any corrective or pre-emptive measures before the real catastrophic situations.
There are different ways and different tools available which can be used to monitor TIBCO BW based solution’s performance after deploying into the administrator. One such famous tool is JConsole (Java Monitoring and Management Console) which is a JMX-compliant monitoring tool and comes clubbed with JDK.
In this post; I am going to explain step by step how to monitor performance of a deployed TIBCO solution using JMX Console.
Step 0: Develop and Deploy a TIBCO BW solution
I am calling this step as Step 0 as this is something that should be already done by you; i.e. you should have already designed and developed some TIBCO solution and deployed in the server using TIBCO administrator.
For this example; I have created a simple solution that is based on HTTP protocol. The deployed solution has one interface exposed which listens on a specific HTTP Port and expects one parameter as input (name) and sends back a response message or an error message in case of any error or exception.
I am not going to dig deep into the development part of this simple solution as focus here is to explain the performance monitoring part.
Step 1: Update Application TRA with JMX monitoring Configurations
In order to monitor performance of a specific TIBCO solution; you need to add a few lines into the TRA file of that application. In my example case; I have an application deployed in the administrator with the name PerformanceTesting. In order to monitor performance of this application; I need to update the TRA file PerformanceTesting-Process_Archive.tra available on the below path:
C:\tibco\tra\domain\DOMAIN_NAME\application\PerformanceTesting\
Following lines need to be added to this TRA file:
Jmx.Enabled=true
java.property.com.sun.management.jmxremote=true
java.property.com.sun.management.jmxremote.port=8999
java.property.com.sun.management.jmxremote.authenticate=false
java.property.com.sun.management.jmxremote.ssl=false
java.extended.properties=-XX\:+PrintGCDetails -Xloggc\:/tmp/ESB-gc.log
Once the above JMX configurations have been added in the tra file; you need to restart the service from administrator.
Step 2: Monitor TIBCO Performance using JConsole
Once you have updated the TRA file with JMX specifications and restarted the service; open JConsole application for monitoring. JConsole should be present in the bin folder of your JDK.
Once you open JConsole; in the login window; choose Remote Process option and specify hostname and port in the text box. Port should be same as the one given in the TRA file in previous step.
Since we set jmxremote.authenticate option as false in our TRA configurations; there is no need to specify username and password.
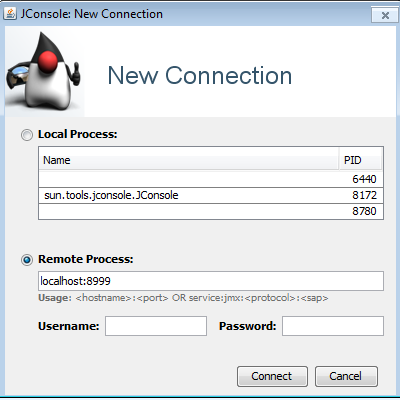
Now click on the Connect button. You will get a message regarding failure to connect securely; just ignore it and choose the option to connect insecurely.
Once you are connected; you will see window like below showing memory, CPU utilization graphs along with threads and classes statistics:
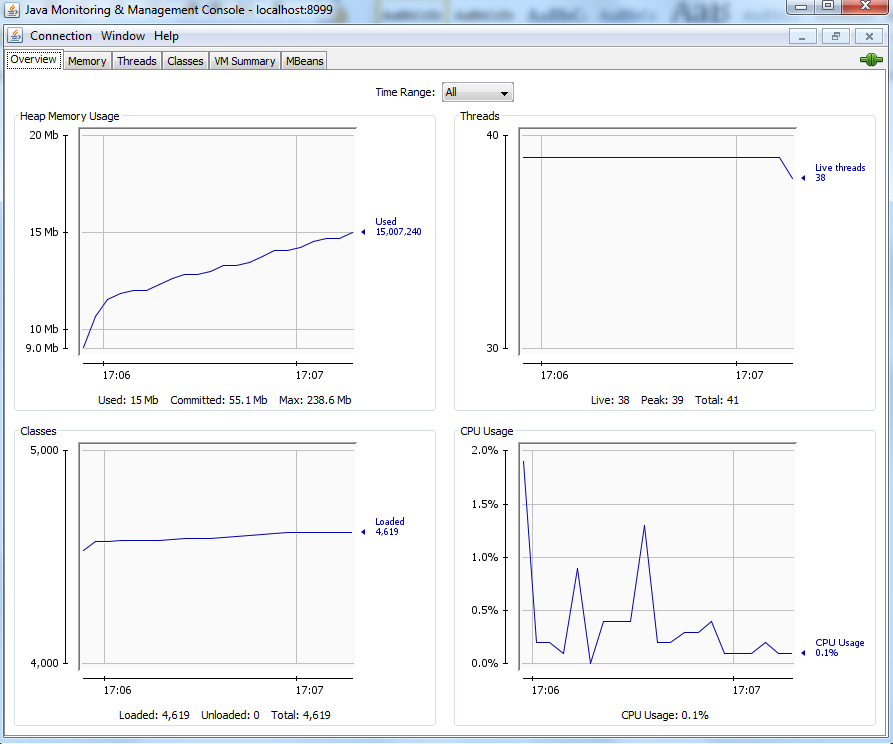
Now, you can start sending more loads to your running process (by sending HTTP data in bulk) and you will see the changing graphs in real time. This way you can analyse the performance and observe the trends in order to ensure that your application can cope with the production data loads.
excellent guide
Very good one.
good one, one clarification
1. for monitoring one service, we gave 8999. for monitoring each service do we need to give unique port.
2. lets say we have 50 tibco bw applications on a particular machine, do we need to give 50 unique ports to each of these bw applications and then monitor them separately using different instances of jconsole (each connecting to each of the bw applications)
3. is there a better tool, just connect to domain and machine, and get to see different applications (tibco administrator) and then select the application you would like to monitor which shows real time graphical view of the CPU, Memory)
I also have the same doubt. Can anyone clear my doubt.
Hi,
I tried without administrator setup
1. added the JMX configuration lines to TIBCO_HOME\bw\\bin\bwengine.tra
2. started the designer, loaded and run the bw application with sleep in it
3. jconsole says connection refused when tried to connect to localhost:
Thanks in advance for any help to resolve this